On my personal journey into precision agriculture and analytics, I came across NDVI in the context of imagery analysis. My objective is to analyze a 45-hectare field of organic alfalfa in order to evaluate the fertilizer’s effect before and after application. My primary question is: where, what kind, and how much fertilizer should I apply, and what effect will it have on the lucerne crop? I own a Mavic Pro camera with a standard RGB camera. When I asked on Twitter how to proceed, someone suggested using multispectral data to explore a range of Vegetation Indices to help, including NDVI. So, I delved deep into the rabbit hole to learn more about NDVI.
What is the Normalized Difference Vegetation Index (NDVI)
History of NDVI
How do you calculate NDVI?
NDVI in agriculture
What type of (drone) camera for NDVI? RGB & IR-upgraded vs Multispectral
Why Multispectral Images are important in agtech
The Normalized Difference Vegetation Index (NDVI) is a widely adopted method to evaluate the amount of live vegetation in a specific region, especially in agriculture.
What is NDVI (Normalized Difference Vegetation Index)
Plants are amazing organisms that use sunlight as energy to make their own food. They do this through a process called photosynthesis, which occurs in their leaves. Interestingly, plant leaves not only absorb sunlight, but they also reflect some of it back. This is particularly true for near-infrared light, which is invisible to our eyes but makes up half of the energy in sunlight.
The reason for this reflection is because too much near-infrared light can actually be harmful to plants. So, they have evolved to protect themselves by reflecting this type of light. As a result, live green plants look dark in visible light, but appear bright in the near-infrared spectrum. This is different from clouds and snow, which tend to look bright in visible light but dark in the near-infrared spectrum.
Scientists can take advantage of this unique trait to study plants using a tool called NDVI, or Normalized Difference Vegetation Index. NDVI measures the difference between the amount of red and near-infrared light reflected by plants. The more leaves a plant has, the more these wavelengths of light are affected, which can give us important information about plant health and distribution.
NDVI is a way for scientists to use satellite images to study plants and agriculture. By understanding how plants interact with sunlight, we can learn more about the world around us and how to care for our planet.
Summarized: NDVI is a standardized measure of healthy vegetation. It quantifies vegetation by measuring the difference between near-infrared (NIR) and red light. Healthy vegetation reflects more NIR and green light than other wavelengths, but it absorbs more red and blue light. NDVI values always range from -1 to +1.
History of NDVI
In 1957, the Soviet Union launched Sputnik 1, the first artificial satellite to orbit Earth. This led to the development of meteorological satellites, such as the Sputnik and Cosmos programs in the Soviet Union, and the Explorer program in the U.S. The TIROS series of satellites were launched in 1960, and were followed by the Nimbus satellites and the Advanced Very High Resolution Radiometer instruments on the National Oceanic and Atmospheric Administration (NOAA) platforms. NASA also developed the Earth Resources Technology Satellite (ERTS), which became the precursor to the Landsat program.
The Landsat program was launched in 1972 with the MultiSpectral Scanner (MSS), which allowed for remote sensing of Earth. One early study using Landsat focused on the Great Plains region of the central U.S. Researchers found that solar zenith angle across this strong latitudinal gradient made it difficult to correlate the biophysical characteristics of the rangeland vegetation from the satellite spectral signals. They developed the normalized difference vegetation index (NDVI) as a means to adjust for the effects of solar zenith angle. NDVI is now the most well-known and used index to detect live green plant canopies in multispectral remote sensing data. It is also used to quantify the photosynthetic capacity of plant canopies, but this can be a complex undertaking.
How do you calculate NDVI?
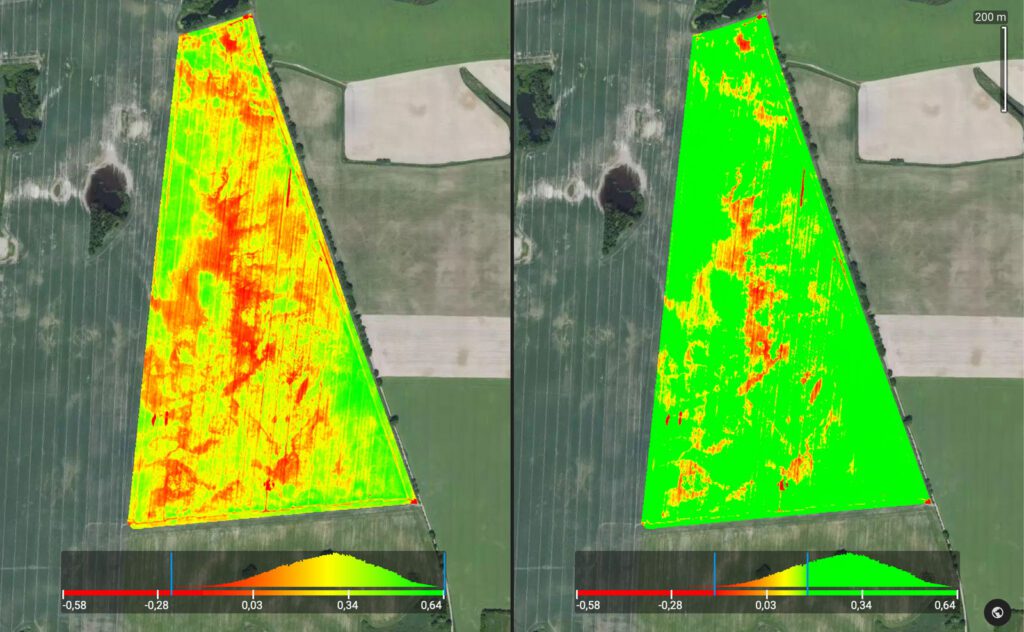
NDVI uses the NIR and red channels in its formula. Satellites like Landsat and Sentinel-2 have the necessary bands with NIR and red. The result generates a value between -1 and +1. If you have low reflectance in the red channel and high reflectance in the NIR channel, this will yield a high NDVI value, and vice versa.
| Value | Indication |
|---|---|
| < 0 | Inanimate / dead material |
| 0 -> 0.33 | Unhealthy plant material |
| 0.33 -> 0.66 | Healthy plant material |
| > 0.66 | Very healthy plant material |
NDVI in agriculture
NDVI has several applications in different sectors. Foresters use NDVI to quantify forest supply and leaf area index, and NASA states that NDVI is a good indicator of drought. When water limits vegetation growth, it has a lower relative NDVI and density of vegetation. Other sectors that use NDVI include environmental science, urban planning, and natural resource management.
NDVI is widely used in agriculture to monitor crop health and optimize irrigation. Farmers use NDVI for precision farming, to measure biomass, and to identify crops that need more water or fertilizers.
How to use NDVI? Satellite imagery vs. Drone imagery
Which satellite imagery has near-infrared for NDVI? As mentioned before, satellites like Sentinel-2, Landsat, and SPOT produce red and near-infrared images. There is free satellite imagery data sources on the web, that has data that one can download and create NDVI maps in ArcGIS or QGIS.
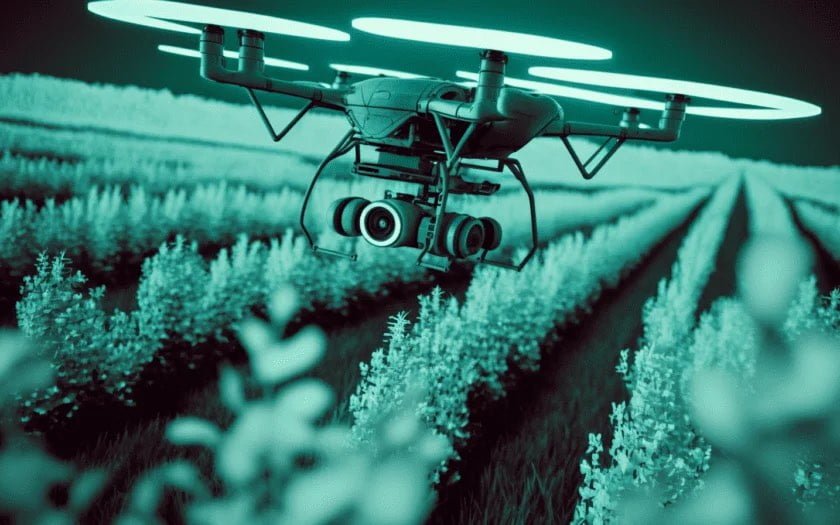
Crop health is a critical aspect of precision agriculture, and NDVI data is a valuable tool for measuring it. Today, the use of agricultural drones has become common practice in pairing NDVI data to compare measurements and identify potential crop health issues. By measuring the difference between near-infrared and red light, NDVI can help farmers optimize irrigation and identify crops that need more water or fertilizers.
For example, PrecisionHawk and Sentera provide agriculture drones that can capture and process NDVI data within one day, which is a significant improvement over traditional NDVI techniques that often require long wait times. Researchers have found that NDVI images can even be obtained using standard digital RGB cameras with some modifications, and this approach can be integrated into crop health monitoring systems.
Mobile applications have proliferated in recent years, utilizing NDVI data as a means of monitoring crop health. Doktar’ Orbit is one such app that provides farmers with NDVI data presented as health maps to identify any anomalies in their fields. These apps aim to revolutionize farming practices by providing new ways of field scouting and digitalizing agriculture. Remote field monitoring tools based on NDVI technology can save farmers significant fuel costs by reducing the need for frequent field visits, and can help with efficient irrigation management.
What type of (drone) camera for NDVI? RGB & IR-upgraded vs Multispectral
Okay.. so this is kind of a hot field I noticed, and the rabbit hole goes deeper and deeper.
Standard RGB cameras are designed to capture Red, Green, and Blue light, while modified cameras can capture a combination of Near Infrared, Red, Green, and Blue light depending on the model. To generate RGB plant health maps showing the “greenness” of crops, one can use a standard RGB camera with specific algorithms in software.
Some companies are selling “fake” Ag or NDVI cameras, which are just regular cameras with an infrared filter removed and a blue filter installed. However, these cameras are inaccurate for radiometric measurements like NDVI because there is too much overlap between color channels, and they do not have a sensor to account for differences in lighting between visits. As a result, these cameras can only show relative differences in a given area, but not accurately measure NDVI.
A real and calibrated NDVI camera will take into account lighting differences and provide consistent outputs between multiple visits to the same site. So be careful when buying a modified “NDVI camera” that captures Near-Infrared Light, to upgrade drones (already for $400) to capture near-infrared (NIR) imagery in order to carry out vegetation health analysis by NDVI calculation. But please be aware: This is not a real NDVI camera, and this may be misleading. A Sentera camera is already a better option because those are purpose-built and can be calibrated, but they still fall short of a full NDVI system. Multispectral cameras, actual NDVI cameras are expensive, much more costly than the “upgraded RGB/IR cameras”. Parrot’s Sequoia at $3500. TetraCam ADC Snap $4500, MicaSense’s RedEdge $6000+.
Multispectral imagery is important in agriculture because it can provide more detailed and accurate information about crops and soil than traditional RGB cameras.
Why Multispectral Images are important in agtech
Multispectral imaging captures image data within specific wavelength ranges across the electromagnetic spectrum, using filters or instruments that are sensitive to specific wavelengths. It extends beyond the visible light range to include infrared and ultraviolet light, enabling the extraction of additional information beyond what the human eye can detect with its visible receptors for red, green, and blue. Originally developed for military target identification and reconnaissance, multispectral imaging has been used in space-based imaging to map details of the Earth’s coastal boundaries, vegetation, and landforms. It has also found applications in document and painting analysis.
Here are a few reasons why multispectral imagery is better suited for agricultural applications:
- Greater spectral resolution: Multispectral cameras capture images in multiple narrow bands of the electromagnetic spectrum, which allows for more detailed analysis of the specific wavelengths of light that plants absorb or reflect. This can help identify issues such as nutrient deficiencies or disease before they are visible to the naked eye.
- Enhanced vegetation indices: By comparing the reflectance values of different wavelengths of light, multispectral cameras can create more sophisticated vegetation indices than traditional RGB cameras. These indices can be used to measure plant health, growth, and stress levels more accurately.
- Differentiation of soil types: Multispectral imagery can also differentiate soil types more effectively, which is important for precision agriculture. This can help farmers make more informed decisions about irrigation, fertilization, and crop management practices.
- Detection of water stress: Multispectral cameras can also detect water stress in crops by measuring the amount of infrared radiation they emit. This can help farmers determine when and how much to irrigate.
Multispectral imaging typically measures light in a small number of spectral bands, ranging from 3 to 15.
Hyperspectral imaging is a specialized form of spectral imaging, where hundreds of contiguous spectral bands are available for analysis. By capturing image data across numerous spectral bands, hyperspectral imaging allows for more accurate identification and analysis of materials than multispectral imaging.
I think I need to stop this dive right herer. I hope you learned as much as I did.